This talk was given 23 June 2011
The text here may not be identical to the spoken text
WELSH LOCAL GOVERNMENT ASSOCIATION 23 JUNE 2011
I’m
Paul Lewis a freelance financial journalist. Among other things I present Money
Box on Radio 4. But I am here today to talk on my own account and not to
represent any of my clients including the BBC.
My
talk today is called Pensions and deficit (with a bit on inflation). In fact it
is two bits on inflation – one after pensions and one after deficit. but I
mention it separately because I think inflation is the real financial problem
that we face – and the one that no-one is addressing.
Pensions
Let
me start by saying you should not object to local government pensions being
described as ‘gold-plated’. Gold plated means something made of copper and then
covered it with a microscopic layer of gold as little as half a micron (2000 to
the mm) thick to make it look valuable. Golden watch cases and jewellery are
often just gold-plated copper. So if your pensions are called gold plated rather
than solid gold you should be grateful. And you may well say to me that in
future they will only be gold plated.
There are three changes planned for your pension and they are accurately summed
up in the familiar phrase pay more, work longer, get less. So my job today is to
explain what I understand the extent of those changes, consider whether they are
fair, and look at what compromise might be on the table.
Pay
more
You
all know I am sure that the plan is to increase contributions to public sector
pensions by 3.2% - or rather 3.2 percentage points because the plan is to raise
contributions from, say, 6% to 9.2%. Which is a rise in the money you pay out of
your salary of more than 50%.
When the original percentage announced in October of 3% rose to 3.2% my
understanding was that the extra 0.2% came from the promise that the armed
forces would see no rise – indeed make no contribution as they currently pay
nothing and will continue to pay nothing. That promise was made by the Prime
Minister and confirmed by the Chancellor in his Budget speech this year. My
belief was that the 0.2% will meet the cost of not increasing that zero
contribution. But the Treasury tells me that was not the case and the need to
raise the money Ł2.8bn a year was the reason for the rather odd 3.2% average
increase. I might also point out that the concession for the armed forces
applies not just to the privates and sergeants and captains risking their lives
and limbs in Afghanistan it also applies right up the ranks to the Admirals,
Generals and Chiefs of Staff sitting in Whitehall advising the Government – if
they are in uniform.
Danny Alexander announced on Friday that anyone earning less than Ł15,000 a year
would also see no rise in their contributions and those earning between Ł15,000
and Ł18,000 would face a rise of just 1.5%. Or did he? That is what he said but
in the written material those numbers were expressed as Ł15,000 (FTE). Now what
that means is that the freeze and 1.5% rise will apply to those in posts whose
full time equivalent salary would be less than Ł15,000 or less than Ł18,000. So
a part-timer earning Ł10,000 a year could easily be earning too much to get
either of these concessions.
I
was told yesterday by the Treasury that this is a proposal and that how this
applies to low paid people is still up for negotiation.
What will happen above those levels we do not know. That is also part of the
negotiations that are going on at the moment – though it might be helpful if the
Government did not keep popping out and saying what they were going to do. But
for the higher paid it could mean contributions rising by five percentage
points. And of course the most important thing is to be clear what the rise will
be for those earning the average – around Ł26,000 a year.
Whatever the outcome of those negotiations – behind closed doors, in speeches to
the IPPR, or on the streets and picket lines – there seems little doubt you will
have to pay more. The question is – should you?
There are still a lot of final salary pension schemes in the private sector –
though the number is declining and the number open to new members is now very
small. Contributions into those schemes are collected each year by the Office
for National Statistics. And the latest figures from Pension Trends are in this
graph.
Source: Office for National Statistics Pension Trends April 2010 Chapter 8
For
final salary scheme, or salary related schemes in fact, the average total
contribution going in is 21.5% with the employee paying 4.9% and the employer
paying 16.6%.
So
if your contributions are currently 5.5% to 7.5% depending on the scheme, you
are already well above the average.
Source: Office for National Statistics Pension Trends April 2010 Table 8.2
nother graph taken from Pension Trends shows the proportion of schemes in each
band of employee contribution rate. The trend has been up and it also shows that
at 6% and over you are probably in the sort of median area. And with another 3.2
ppts added on you will be among the highest contributors towards a salary
related scheme.
But, of course, the other side is that the employer also pays in – and the
employer is the council or local Government office you work for and that money
comes from taxpayers one way or another because the taxpayer is your employer.
And I know there is no fixed contribution – with 99 schemes and 9 of them in
Wales that would be too much to expect!
But
the important thing to recognise about the contributions is that you are buying
a very valuable pension. Now I know the average paid out is quite low. But that
is because pay is quite low, part-time working quite common, and working for
local government for a short time is not uncommon.
However, I learned two things yesterday from the Treasury – and they surprised
me but I have to take the word of the man I spoke to.
First, that the Government recognises the different circumstances of the LGPS
there are different issues and we would not rule out a different settlement. The
differences principally being of course that your schemes are funded – not
adequately and they have deficits but they are funded.
Second, the extra contributions from local Government workers are not part of
the Ł2.8bn the Government wants to raise and will go directly into the pension
schemes – not the Treasury.
So
you will pay more – exactly how much we do not know. But it will start from
April 2012.
The
two other changes – work longer and get less will not. They will start later
probably 2015 that’s the target date. And in the month they start you will
probably be voting in a General Election as that is fixed for 5 May 2015.
Work longer
Now
I am not going to rehearse the arguments for doing this. Though I have to say
life expectancy is growing by about 3 months every year that passes. And I do
think it is reasonable that pension age rises. The Government now says it wants
public sector pension age to rise with state pension age. And few things get as
many emails as that topic. Your pension scheme age is already 65 and so that
will not rise until after November 2018 when under the new timetable set out in
the Pensions Bill the state pension age for women reaches 65 and then it will
reach 66 by April 2020. After that it will rise further but we do not know when
that will start or finish.
That new pension age will only apply to the pension earned after the date the
change begins. So if the change begins in April 2015 all the pension earned
before that date can still be claimed at 65. All the pension earned after that
date cannot be claimed until you reach state pension age.
Get
less pension
The
final element is that the pension paid will, in many cases, be less than the one
you would get under the present scheme. And let me say at the start – that I
agree with this change.
It
will move all public sector pensions from their present structure where the
pension you get is a fraction of your salary at the time you reach pension age
(or leave the scheme) to one which is still based on your salary but is related
to your average salary over your time in the scheme.
And
I support that not because it will give some people lower pensions – though it
will – and it will give no-one higher pensions – but because it’s fairer. And
it’s fairer to the low paid and as that tends to be women fairer to them.
My
mind was changed on this by the interim report of the Hutton Independent Public
Service Pension Commission last year. John Hutton compared final salary schemes
with schemes where the pension is based on career average earnings. And noted
that high-flyers can get double the pension benefit from their pension
contributions than those who are not high flyers.
This analysis was not original. It used a paper from 2007 by Charles Sutcliffe
of the ICMA centre at Reading University.
He
found that a high flyer whose pay rose by 3.5% a year in real terms over a 40
year career would end up with pay of just over double that of a low flying
colleague who stayed in the same job for 40 years and gained no real rise in
pay.
But
because the pension was related to final salary, the pension earned by that pay
was not 2.02 times higher but 3.83 times higher. And that means that for each
pound he pays in, High Flying Henry earned nearly twice the pension that Low
Flying Louise earns for each pound she puts in.
Each Ł1000 of contributions Henry pays in buys him a pension of Ł178.24. Each
Ł1000 Louise pays in buys her just Ł94.18. That is a ratio of 1:1.89 – not quite
half as Hutton said but not far off. And you can devise scenarios which are even
worse.
Hutton gives the high flyer a woman’s name. And the low flyer a man’s. But that
isn’t the reality is it? We know that despite 40 years of equal pay laws women
earn less than men. We know that women have a lower chance of promotion than
men. We know that women are more likely to work part-time than men. And we know
that women get lower pensions than men. And those facts are of course all
related. So I have stuck with the sexist reality not embarked on the political
spin of women out-performing men – some do of course; but men conspire to stop
them when they can.
There are other inequalities. High flyers are more likely to be paying higher
rate tax – so their pensions are more heavily subsidised by the taxes paid by
others – including poor Louise of course. Every Ł1000 pound she pays in gets a
treasury contribution of Ł250. Every Ł1000 Henry pays in gets a Treasury
contribution of Ł667. That makes a big difference and on my calculation
increases the amount of pension earned for each Ł1 spent out of
net income from Ł1.89 to Ł2.52.
And
of course from this April when the 50% tax rate began on taxable income above
Ł150,000 a year the subsidy is even bigger for the very high flyers. Someone on
Ł250,000 salary who puts the new maximum of Ł50,000 into a pension will find it
is matched pound for pound by a generous Treasury – yes from the taxes of those
very people on Ł15,000 a year who probably have no pension scheme and no
personal pension either. And just to be clear: you earn Ł250,000, put Ł50,000
into a pension scheme out of your taxed income and George Osborne stumps up
another Ł50,000 in subsidy.
This slide is a bit out of date but it shows how the minority if higher rate
taxpayers get the bulk of the tax relief on pensions.
And
beyond that, Henry, being richer and living in a nicer neighbourhood is probably
going to live longer – if not than Louise because nature does take its revenge
at this point on men for their lifelong selfishness towards women – then
certainly longer than low flying Louis. The man in the back office who keeps his
low paid administrative job all his life.
So
Henry will get a bigger pension; get more per pound contributed; pay less for it
due to the bigger Treasury taxpayer subsidy; and draw it for longer than low
paid colleagues. No wonder he’s called Hooray Henry.
In
other words final salary schemes work by stealing money from low flyers and
giving it to their bosses. And I do not think that is right.
All
this assumes of course that Henry is promoted on merit. But you will know as
trustees that final salary pension schemes with surpluses have been used as a
way to get rid of difficult older staff, to free up the promotion ladder, or
just to give mega-rewards for friends of the directors.
Career average can end all those abuses. And that is why the civil service
pension scheme moved to it in 2008. At the moment the civil service scheme is
alone among public service pensions. But the Government has made it clear that
it will follow Lord Hutton’s recommendation in his final report to move all
schemes to career average.
But
the Government has also made it clear that any pension earned up until this
change begins – probably April 2015 – will be protected. And when you reach your
existing pension age 65 you will get a pension based on your accrued rights up
to April 2015 and a proportion of your final salary at the age of 65.
INFLATION
Inflation is the filling in the sandwich – one slice of pensions and another of
Government debt with inflation in the middle because it affects both
substantially.
Pensions are affected because the government has already from April this year
changed the way that public sector pensions are protected against inflation. It
changed the method of indexing from the Retail Prices Index to the Consumer
Prices Index. Now if you listen to Radio 4 bulletins you probably think you know
the difference between RPI and CPI. RPI is the one that includes housing costs.
That is what the news bulletins always say. I have tried to get it changed but
failed.
Now
it is true that RPI does include housing costs such as mortgage interest,
depreciation, and council tax. But that is not the main factor in the difference
between them. The main factor by
far is the formula effect – the difference in the maths how the index is worked
out.
At
the moment CPI is 4.5% and RPI 5.2% – a difference of 0.7%pts, normally
expressed as CPI-RPI. But that difference is not due to housing costs. Although
we take RPI and CPI to one dp in fact they are worked out to more. And the
difference between them is -0.74. That is made up of -0.09% due to housing costs
being in RPI but not in CPI, +0.16 due to coverage – the other items included.
+0.19 due to weights and other differences. And -1.00% due to the formula
effect. In other words if the formula effect was not there CPI would actually be
higher than RPI in May 5.5% not 4.5%.
At
the heart of the difference is mathematics. Each month 300 agents record 180,000
prices in 20,000 shops. They are turned into an average for the price of, say,
bananas. But just what is an average? In five shops a single banana costs 14p,
18p, 20p, 40p, and 63p.
The
RPI uses the simple arithmetic mean – you add up all the prices for bananas and
divide by however many there are. The RPI would call the average price 31p.
But the CPI does things differently. You
multiply all the prices together. And then take the nth root – where n is the
number of items. That gives what is called the geometric mean and that is –
26.3p.
That method takes account of the fact that if the price of bananas rises we buy
fewer of them – or we switch from organic to an own brand bunch. In other words
as inflation bites we try to keep the share of what we spend on bananas the
same.
And
the geometric mean is always less than or equal to the arithmetic mean. So CPI
is almost always lower than RPI. Which is why the Government prefers CPI when it
raises pensions or benefits. And chooses RPI when it comes to putting up the
duty we pay on petrol and alcohol.
And
the formula effect which was 1% in May is pretty constant now around that level.
So you can reckon that the CPI should pretty much be 1% higher if that
mathematical difference was not used.
It
may not seem much. But it makes a huge difference and of course is compounded
every year. The change will save Ł1.5bn this year, Ł3.05bn min 2012/13 and as
much as Ł10.595 billion in 2015/16. That is mainly benefits but a proportion of
that is public sector pensions.
The
Government has decided that private sector pensions can move to CPI if their
trust deed allows – and the minimum they must do set down by law is to be
changed to CPI – but they can if they wish move to RPI. In fact the effect is
limited because that is capped at 5% or 2.5% and that brings it below either
measure. So public sector is still lucky that it is given an uncapped increase
with inflation, albeit CPI now rather than RPI.
Inflation is not supposed to be 4.5% (5.2% if you go by RPI). In fact it is
supposed to be 2%. The Bank of England is supposed to control it to bring it
down to that level but it has been above its target for the last 18 months.
Normally inflation is controlled by raising or lowering interest rates. As the
Bank Rate rises the cost of borrowing rises and people and businesses are
inclined to borrow less and that slows down the economy and businesses can’t put
up price or have to cut them to encourage people to buy. So inflation falls.
Similarly when Bank Rate is cut that stimulates the economy and inflation tends
to rise.
That is the simple theory and the MPC for years had one lever to pull or push –
raising or lowering Bank Rate.
But
after the financial crisis of 2008 the most important thing was stimulating the
economy so interest rates were cut back and back to reach their lowest ever 0.5%
where they have been stuck for more than two years. And for fear of stopping the
rather halting economic growth the Bank dare not raise rates. So the one lever
it has to control inflation is denied it.
Worse than that, the Bank was worried that even 0.5% interest rates would not
get the economy growing. So in March 2009 it took another step called
Quantitative Easing. Also know as printing money. So far it has created, out of
nothing, Ł200 billion. That has not been printed – if it had the stack of notes
would be about 2000km high. But printing money to get out of a financial mess is
what one fund manager the other day called the economic policies of African
despots. But if you talk to normally rational economists they will now tell you
that QE will somehow not cause inflation – or not much anyway.
But
when the USA is also doing it and on a vastly bigger scale about $2 trillion so
far and a third round could be on the way – that affects us too. Oil and gold
and other more useful metals are priced in dollars. And if you just print more
dollars the price of this real stuff is bound to go up. So it is not just our QE
that is boosting inflation here, US QE is helping it along. And that is why the
Bank tells the Chancellor that rising commodity prices have pushed up prices
here and who could have predicted that? Well, anyone who knew that the US
Government was planning to print $2 trillion.
So
the Bank of England is failing in its key objective of controlling inflation.
And inflation is partly the reason why pensions – including public sector
pensions – are becoming more expensive.
And
of course we now know sort of officially what we have known for a long time.
That inflation in commodities – in real stuff particularly food and fuel –
affects low income households more. Because more of their money is spent on
those basics.
Inflation of course destroys the value of savings – with inflation at 5.2% money in the bank is worth less each year.
Here is what would happen to Ł1000 year by year. It halves in value – in terms
of what it will buy – in just 13 years. And then carries on of course – and you
can see by 2030 – after 20 years it is barely a third and of course that process
continues beyond the end of that slide. With inflation at 5.2% and interest
rates earned at little more than half that if you move your money every year
chasing good rates you cannot protect your savings against inflation still less
earn enough to give you an income.
DEBT
Now
the reason given for raising contributions to public sector pensions and to and
cutting the pensions you will earn is to save money. I mentioned earlier that
the switch from RPI to CPI will save more than Ł10bn a year by 2015/16. And the
increase in contributions is set to raise Ł2.8bn – excluding the contributions
paid by people in your schemes.
And
that and the many other cuts announced by the Coalition Government are designed
to close the gap between the Government’s annual income – which is basically all
the taxes we pay – from income tax and VAT to corporation tax and the duty on
alcohol. And the amount it spends each year.
That difference is the deficit – the amount we spend above what we earn each
year.
The
debt – the national debt – is the accumulation of all those past years of
deficit. So we overspend Ł146 billion this year and Ł122 billion next year we
owe another Ł268 billion. And in fact the total we owe is around Ł970 billion –
nearly a trillion.
That is our debt – that is if you like the nation’s credit card. And I will tell
you something that George Osborne doesn’t seem to know. We are not paying off
the nation’s credit card. Our debt
our credit card balance is growing.
All
that the Government is doing with all these cuts painful as they are is reducing
the amount we have to borrow each year. The Budget will not be in balance – ie
spending no more than we earn until 20xx on the Government forecasts.
Inflation part 2
And
that brings me to part 2 of inflation.
The
context is the complete failure of the Bank of England not just to control
inflation but to realise it was doing so. As part of its job the Bank does not
just decide on interest rates every month. Once every three months it produces a
report on inflation – why it is where it is and where it is going.
Let
me show you a graph I did recently. I went back through these reports and looked
at where the bank said inflation would be today and where it in fact is.
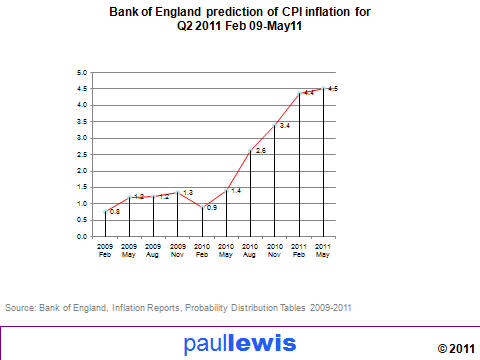
This graph shows what the Bank predicted inflation would be now at various times
in the past. In Feb 2009 it thought we would have inflation now of 0.8%, that
rose over the next reports and then in Feb 10 the prediction for May 2011was
again 0.9. A year ago it still thought that now inflation would be 1.4%. Then it
rose with the next reports until in May this year it got inflation for May this
year about right. But just to reiterate, a year ago the Bank thought inflation
now today would be 1.4%. It is 4.5%.
The next graph is a bit more complex. This red line shows
actual inflation from the first quarter of 2009 to this quarter Q2 of 2011.
Actual CPI inflation. So two years ago inflation was about 2% and the Bank
thought it would fall – light green line – and then rise gently towards its
target of 2%. It didn’t it rose. Three months later – blue line – the bank
predicted a fall. It rose again. A year ago the Bank predicted quite a sharp
fall – purple line – It did fall but soon rose sharply. At the end of last year
yellow line – Bank predicted a small rise then a fall. It rose and rose. Three
months ago ditto. And now the latest prediction that it will rise to about 5%
but then will fall sharply.
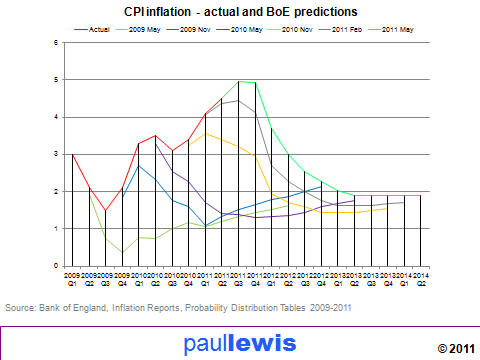
And
notice how every prediction has it hitting the 2% target in two years. And
notice how every single prediction has been wrong.
So
not only is the bank and its highly paid Monetary Policy Committee failing to
control inflation, it is also hopeless at predicting what it will be in future.
Perhaps the two are related.
I
said earlier that inflation destroys savings – if it is 5.2% a year Ł1000 is
only worth Ł500 in 13 years’ time. But it also destroys debt. And a debt of,
say, a trillion pounds will only be worth half a trillion in 13 years time. And
half again after a quarter of a century has passed. And there are some dreadful
cynics who think that the Government doesn’t really care if the Bank of England
fails to reach its inflation target. Because every year that inflation is high,
our national debt is worth less and is easier to control.
They call in evidence the letters written by the Governor of the Bank of England
to the Chancellor. That happens when inflation is amore than 1 percentage point
above its target – so with a target of 2% when inflation reaches 3.1% or more.
And then every third month that it remains there.
All
these letters are on the Bank of England website – I recommend them. The latest
– which is much like the other ten – goes like this.
Dear Chancellor, inflation is a bit higher than it should be because of
international pressures such as rising oil, food, and commodity prices and, by
the way, you did put up VAT and excise duties. If these price rises hadn’t
happened inflation would probably be lower. But I remain confident that within
our two year time horizon it will be back on target as these pressures naturally
fall out of the figures. Yours Mervyn.
Dear Governor, the Chancellor replies. Thank you for your letter. You certainly
have a difficult task and it is not my job to interfere in your independent
considerations. I am glad you are confident that inflation will fall to its
target in two years. Yours George.
Despite two years of abject failure the Bank of England Governor Mervyn King was
knighted earlier this month, for services to inflation no doubt. And when the
Queen touches his shoulder with the sword and says ‘Arise Sir Mervyn.’ will he
reply ‘Yes Ma’am but it will fall back in a couple of years…’
I’ll leave you on that thought.