This talk was given 19 March 2009
The text here may not be identical to the spoken text
Fixings Forum, Thomson Reuters 19 March 2009
Important numbers
Hello. After that introduction you’re probably thinking ‘who’?
I’m Paul Lewis a freelance financial journalist, although best known I guess for my work presenting Money Box on Radio 4. But I also do other things – you can read my weekly thoughts on the Saga Magazine website.
But I am not here representing Money Box or, god forbid, the BBC. It is nice to be here among bankers. Always good for journalists to speak to people in a profession that is even more despised than our own.
Money Box of course is cutting edge journalism. On 4 October last year after press speculation about the safety of Icesave the UK branch of the Icelandic bank Landsbanki, we swung into action and got two top guests.
First, Icesave’s Managing Director Mark Sismey-Durrant. I asked him
‘So UK customers of Icesave can be sure their money is safe and they can get it out when they want?’
‘Yes’, he replied, ‘they can be’.
I am told the run on the bank started at that moment.
I also interviewed Triggvi Herbertsson, the Economic Adviser to the Icelandic Prime Minister. He also told me that the Icelandic banks were safe and if they did collapse the Icelandic government stood by its promise to pay the first €20,887 of any claims. Or rather he said this.
“Yeah, like I say, you know we’re bound by international law to apply to … Yeah, we have to apply to international law.”
Well, they may have been lying, they may have believed it at the time. But if they were at least they were lying to us. Live. The UK government eventually lent the Iceland Government £2.3 billion so Triggvi Herbertsson’s promise could be fulfilled.
Numbers
On to numbers. The
most important numbers. I love numbers. I often annoy my more arty friends by
saying we cannot understand anything we can’t measure or count. As you’ll see I
do tend to count things and my favourite computer programme is a spreadsheet.
Over the last three weeks the most important number was the £693,000 a year pension paid to Sir Fred Goodwin. In fact it turned out to be £703,000 a year after he was given £10,000 a year for life for working the month of January. And of course big numbers were bandied around like £16.63 million which was the transfer value put on his pension by RBS or £28 million or even £33 million estimates of the value of the fund needed to buy such a pension on the open market now for a man of his age – he is just 50.
And just this week it emerged Sir Fred had taken £2.7 million of his pot as a lumpsum with the £1.8 million tax paid by RBS. As a result his annual payment would be reduced to £555,000. He now says he’ll pay the lumpsum back if the Treasury will promise not to come after him for the tax – which technically is still due. Hubris hardly covers it does it?
And of course if the taxpayer had not stepped in to save RBS and it had gone bust his pension would have been taken over by the pension protection fund and instead of £703,000 a year it would have been capped at the PPF upper limit. If he had to wait until 65 – which is probable – capped at £27,771. But if he had been contractually entitled at 50 – unlikely – then it would have been reduced to £21,000 a year. Which is still a pretty decent pension for wrecking a major bank.
Incidentally if you want too see how a man earning a pensionable salary of £898,000 a year can accrue a pension of not much less than that after just ten years’ service it is set out very well by my colleague Ian Pollock on the BBC website http://news.bbc.co.uk/1/hi/business/7949929.stm
LIBOR
It was just when
that large number was being negotiated with Sir Fred that the BBC gave one
figure the accolade of the world’s most important number. Or in fact ‘the
world’s most important number – question mark’. That’s the closest we get to
hedging in the media. That number was of course LIBOR – or BBA LIBOR as we
should call it. And for a time it was one of the most watched numbers by the
press – even more than the FTSE100 index or the exchange rates of the dollar and
euro to the pound which we report every day. But LIBOR – we didn’t really know
or care. And this is why.

![]()
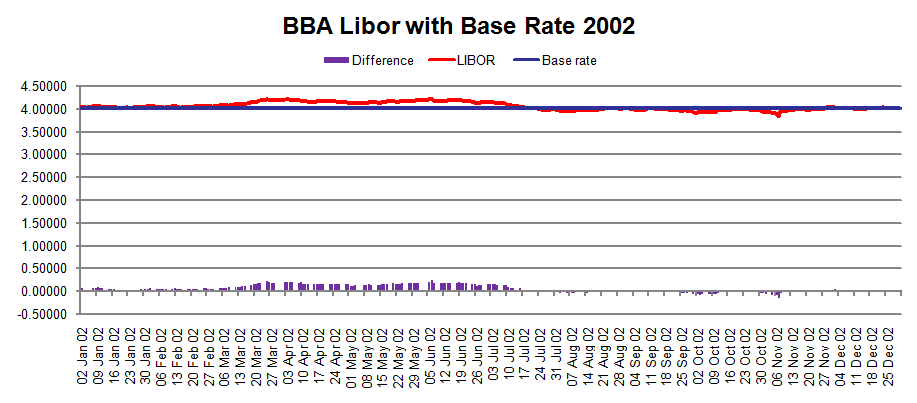
Here we are in 2002 – a period of reasonable financial stability. The FTSE index was still falling from its millennium high. But inflation was within its target, fairly steady and low enough not to worry people. And the bank rate – or base rate as we called it then – didn’t change, it was 4% for the whole year. Lower than its long term average but quite stable and sensible.
And you can see LIBOR fluctuated by tiny amounts – never more than 23 basis points (ie 23 one hundredths of a percentage point) above and on some occasions a few basis points below but never more than 16. The average over the year was about 6 basis points above base rate – 4.06%. You can see the difference between the two numbers in the purple bar chart at the bottom of the graph.
![]()
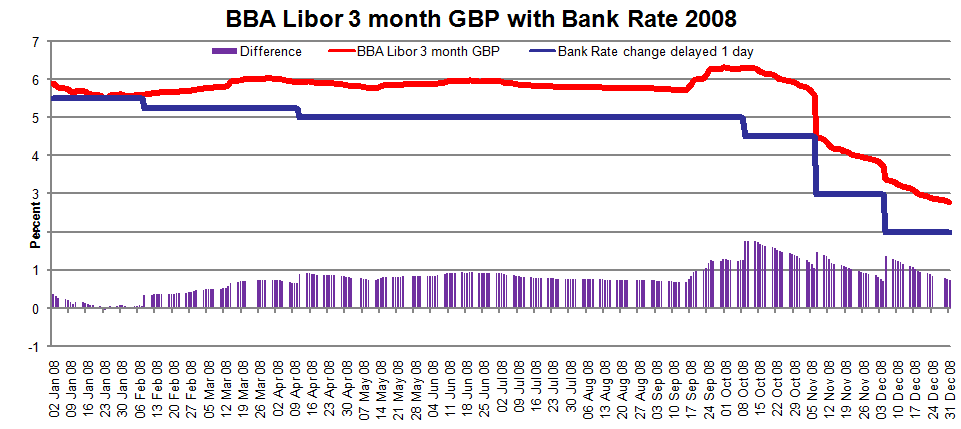
But in 2008 – when that description as the world’s most important number was coined – LIBOR behaved very differently.
It started OK just a bit above base rate which then was 5%. But then when base rate was cut in February LIBOR didn’t play ball, it carried on up. Another cut in bank rate in April. LIBOR remains stubbornly high. Then we have the real beginning of the credit crisis in September and for six turbulent weeks LIBOR remained well above bank rate, peaking at 179 basis points above. (Anorak’s note: I take bank rate as starting the day after it is changed as the day Libor is fixed bank rate has not been announced.)
And it was this cloud like shape to the curve which showed real panic and uncertainty in the markets
A series of cuts in bank rate did bring LIBOR down. But almost reluctantly in a saw tooth way.
Because Libor is the rate that the banks choose to charge each other it is a much more realistic expression of interest rates and the availability of credit in the real world. But it wasn’t LIBOR that people were interested in – it was the difference between LIBOR and bank rate. That was seen as an important measure of trust between the banks. The bigger the gap the less the trust.
And it was taken even further. The difference between LIBOR and bank rate was seen as a measure of the seriousness of the credit crunch itself.
And of course when it peaked at 1.79% above base that was seen as the full expression of that lack of trust. But when that difference fell to about 85 basis points above earlier this month people began to say the credit crisis is over. I heard that said on Monday on the Today programme on Radio 4. But the figures show us that is not correct.
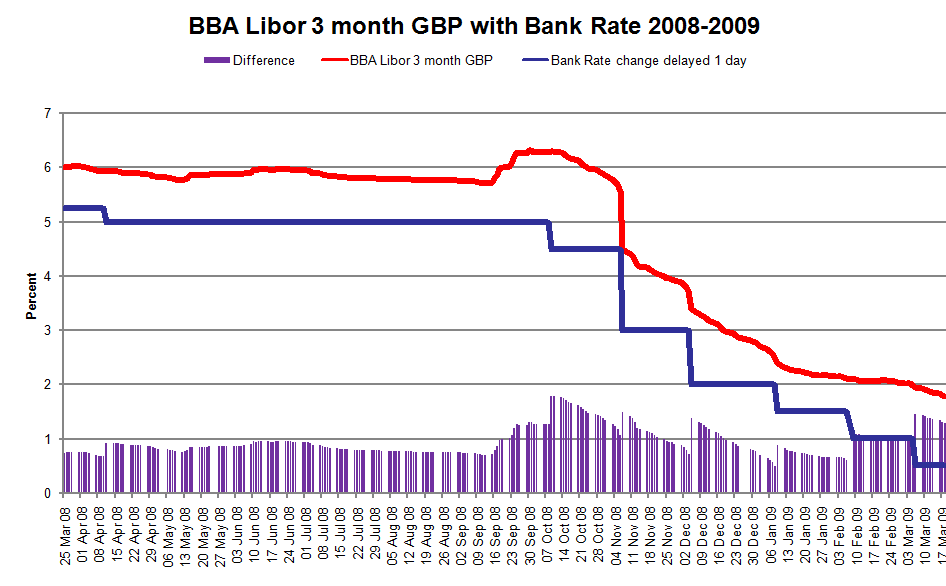
If we look at the graph right up to yesterday this year series of Bank Rate cuts have left LIBOR stubbornly high. The cut to 1% in February did not lead to much of a drop in LIBOR. And the cut to half of one percent two weeks ago on 5 March did even less. LIBOR stays fairly stuck at just below 2%. Yesterday the difference between Libor and bank rate was 133 basis points ie Libor was 1.83%. And the difference now isn’t much different from when bank rate was 3%.
![]()
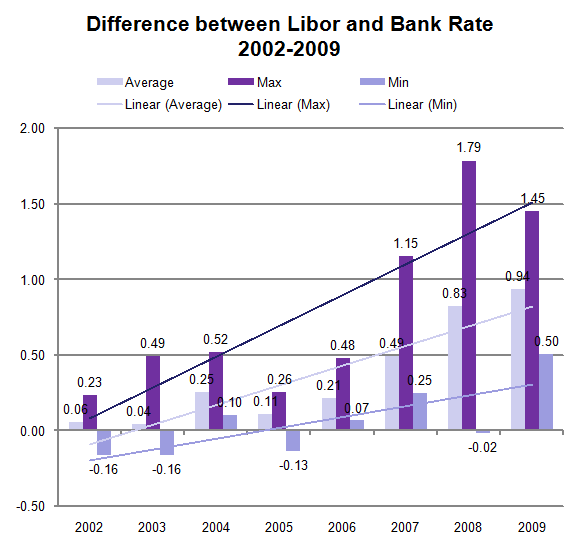
This graph shows the maximum, minimum and average of the difference between LIBOR and Bank Rate. It shows that the average is as high as it has even been at 94 bps. The maximum peaked a few days ago at 145 not much lower than the 179 we saw at the height of the crisis last October. And the minimum is 50bps – which would have been the maximum at any time until 2007. And the trend lines show they are all rising.
So if LIBOR measures a lack of trust and a shortage of credit then we have a very long way to go.
Credit crunch
Credit crunch is
an overworked phrase.
Because I know you like numbers I thought I would look at the use of the phrase in the UK’s national newspapers. There are 24 of them and nowadays it is a fairly trivial matter to count how many times the phrase is used.
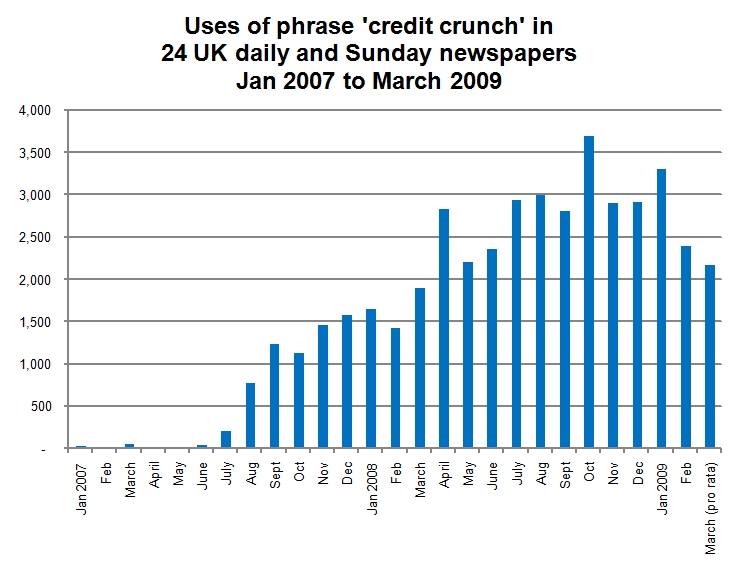
Until the summer of 2007 it was not really used at all. Then it began a couple of hundred mentions in July, more than a thousand in September and then it grew and grew to reach its peak in October 2008 with 3697 mentions – that is 119 times a day.
![]()
And you can see from this graph that the crunch peaked in October and has since fallen off but it is still there. A similar picture to the LIBOR figures. Getting slightly better but still at historic highs.
Of course not all of the thousands of uses of the phrase are about the economy.
The Sun said on Tuesday.
“They may have more dosh than the rest of us, but celebs are not immune to the credit crunch.”
Natasha Fraser-Cavassoni wrote in the Times last week about
“The recession shoe: Pierre Hardy’s credit crunch busting sandals are coming to a High Street near you.”
“Will wild food help us beat the credit crunch?” asks the Guardian on 10 March, in a piece called “How to make free nettle soup by foraging.”
Also in last week’s Times Valerie Elliott wrote:
“Credit crunch takes its toll on range cooker profits – would this be the end of her Aga saga?”
We’ve had the credit crunch crime wave, the credit crunch blues, credit crunch essentials, credit crunch crusader, even have a credit crunch busting stay in an Old English Inn.
A colleague of mine on Radio 4 opened a story on the World at One on 8 July last year with the memorable phrase
“How has the credit crunch affected the sale of whistles”
But the credit crunch isn’t new. It is mentioned in the press somewhere every year for forty years. And the earliest I have found was in The Times on 7 June 1967 it referred to “the great credit crunch of last summer”.
And again in October “the credit crunch of last year”. That was in a reference to the credit crunch of 1966. And it was that year that the phrase was coined by two economists, Sidney Homer and Kenry Kaufman, who worked for the New York investment bank Salomon Brothers (now owned by Citigroup aka Uncle Sam). They want to describe the tight credit conditions in the Summer and Autumn of that year
And just read what led to it.
“It was preceded by a prolonged period of strong loan demand and easy credit conditions. From 1962 through 1965, sales of negotiable certificates of deposit (CDs) - a financial innovation of the time - grew rapidly. The sales funded bank lending, which grew at annual rates exceeding 10 percent”
And far from being journalistic claptrap ‘credit crunch’ does have a precise meaning among economists. It is a ‘period of sharply increased non-price credit rationing’. In other words credit isn’t just expensive, the rationing is not done by raising the price, though the price does rise. Rather, you can’t borrow money at any price.
Figures out today from the CML show that mortgage lending in February was 15% down on January and 60% down on a year ago. Mortgages are cheap now so it is non-price rationing that keeps them scarce. Classic credit crunch.
So the first credit crunch – called by that name – was in 1966. Others followed in 1974 and 1984. And of course credit squeezes or pinches can be traced back further In 1924 I found this reference.
“at a time when the money market is suffering a temporary credit squeeze… markets [wore] a rather depressed look.” (The Times 29 May 1924 p23D)
That’s 84 years ago.
And we can go back even further. This from 1907.
“there is strong demand for credit in all the great centres–so much so that a big American industrial concern has had to shut down for lack of credit facilities.” (The Times 16 August 1907 p11B)
But the best find of all to show that the present problems are not unique
“The want of credit and of money have reduced the different communities to act in the character of arbitrary pawn-brokers, and to impose on public and private creditors whatever terms they please.” (The Times 2 February 1786 p3A)
The was news from America in 1786 showing what happens when there is no proper banking.
And more recently in 1984 we read in The Times editorial “the banks are having to rearrange their loans in order to reduce debt payments by as much as $40 billion this year and must of that extra interest burden will probably go the same rescheduled way.”
And I wonder which politician this is about?
“He is now paying the price of past complacency; a credit crunch and a missed opportunity to cut his deficit at the easiest moment which is when economic growth is strongest. All he can do now is strengthen the political conviction that his cuts package is only the first of many, Changing tack in an election year may be difficult but vacillation has its proven disadvantages” (The Times 11 May 1984)
Not Gordon Brown. But Ronald Reagan seeking re-election in 1984.
And before we end this wander down memory lane, here is my favourite
“With the economy weak and financial markets still hurt by a credit crunch and the collapse of the junk-bond market, this is not a good time for the cold-shower business of repaying, rolling over, or replacing corporate debt.”
That’s the Economist 5 October 1991. Apart from junk bonds – actually including junk bonds if you call them Collateralised Debt Obligations – that could have been written last week.
So the credit crunch isn’t new. And it always comes from the same thing. The banks getting their own business wrong. But then persuading everyone else that no-one else can understand banking as well as they can so they need bailing out so they can carry on making the same mistakes a few years later.
And now we come to some very, very big numbers. The cost of the banking bail out.
Bail out
It was only five years ago that I had to write an article in Saga Magazine
explaining what a trillion was and predicting that it would soon become a very
familiar number. Shortly after that our individual debt including mortgages –
topped £1 trillion and soon after that mortgage debt alone topped a trillion.
Now the total of mortgage and personal debt hovers around £1.5 trillion.
But these numbers are dwarfed by the global cost of bailing out the banks. My colleague Robert Peston estimates that world wide the total amount of money set aside by Governments to bail out the banks in loans, guarantees, insurance, and investment is $15 trillion, or about £10 trillion. Now much of this may not be paid out – some of it is in guarantees or insurance – and some is in loans which earn interest and eventually may even be repaid! But £10trn is the total at risk because the banks who we trusted with all the world’s money got it so horribly wrong – again.
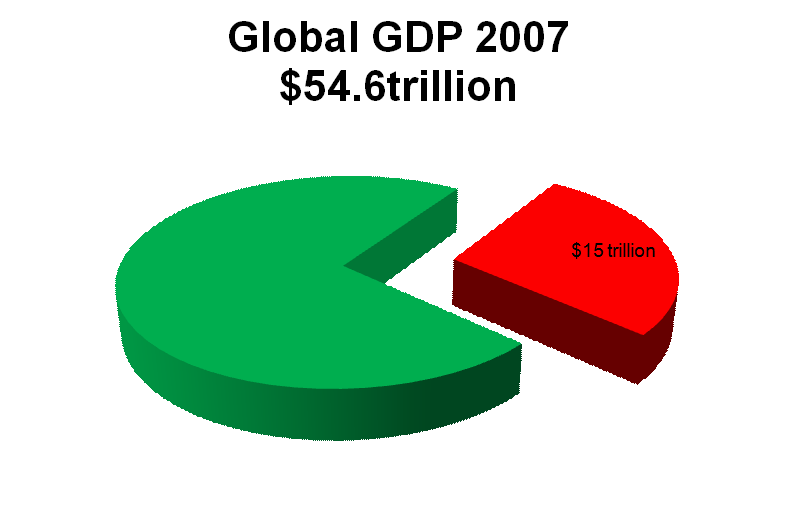
And to put that number in context the GDP of every country on the planet is estimated by the IMF in 2007 to be $54,584,918mn. $15tn is more than a quarter of that. So every human on earth has to work for more than three months just to underwrite the mistakes made by a few bankers who, like Sir Fred, have assured their own wealth while impoverishing others.
And the UK has a big share of that £10 trillion bill.
Just how much is a bit unclear. And the Treasury gets different answers to the rest of us. We may find out more in the Budget next month – or not. I had a long chat with the Treasury expert on this yesterday. Here is what has been announced. But whether it is reasonable to add them up and get about £1.2 trillion is a matter of dispute. The word the Treasury man used about what I was doing was ‘nonsensical’. But the total commitment announced over the last year is rather more than half our annual GDP.
There is also the question of whether you value a bunch of dodgy Northern Rock mortgages as assets – which they are as long as they’re repaid – or liabilities which they may well become with a third of the mortgage book – about £22 billion – in negative equity.
But however you count it the overall willingness to commit public money comes to more than £1 trillion. That’s twice what the Government spends in a year.
My figures include some large numbers for the potential cost of the toxic assets protection scheme taken up by RBS and Lloyds. Again, those figures, or the assumptions I made to get to them, were called ‘impossible’ by the Treasury man. I did point out to him that a lot of things that had happened in the last year would have seemed impossible twelve months ago.
Let me explain them. The two deals are the same in essence but different in detail.
The bank chooses which toxic assets to put into its scheme
The bank pays a premium
The bank bears 100% of the first slice of the loss
The rest of the loss is shared between the bank - 10% - and taxpayers - 90%
And here is how the scheme will work.
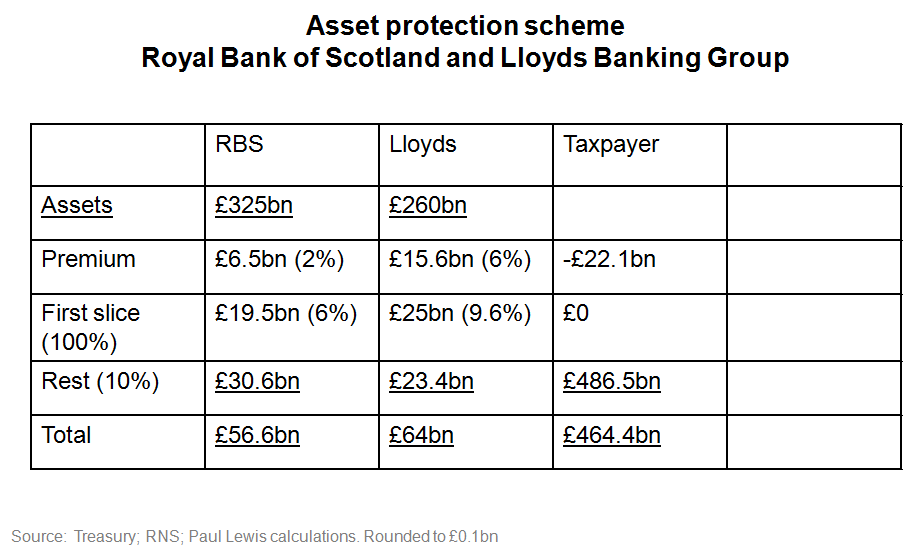
RBS is putting £325bn into the scheme, it pays the government a premium of £6.5bn – 2% of the assets – it bears the first £19.5 billion loss and 10% of the rest so its total possible commitment is £56.6bn – probably about two year’s losses for RBS!
Lloyds will pay a much bigger premium, £15.6bn or 6% of the assets, the first £25bn of any loss and then 10% of the rest.
So if the assets all perform perfectly taxpayers could gain £22bn. But if eventually they are worth nothing we could end up paying out £464bn.
So where is the break even point?
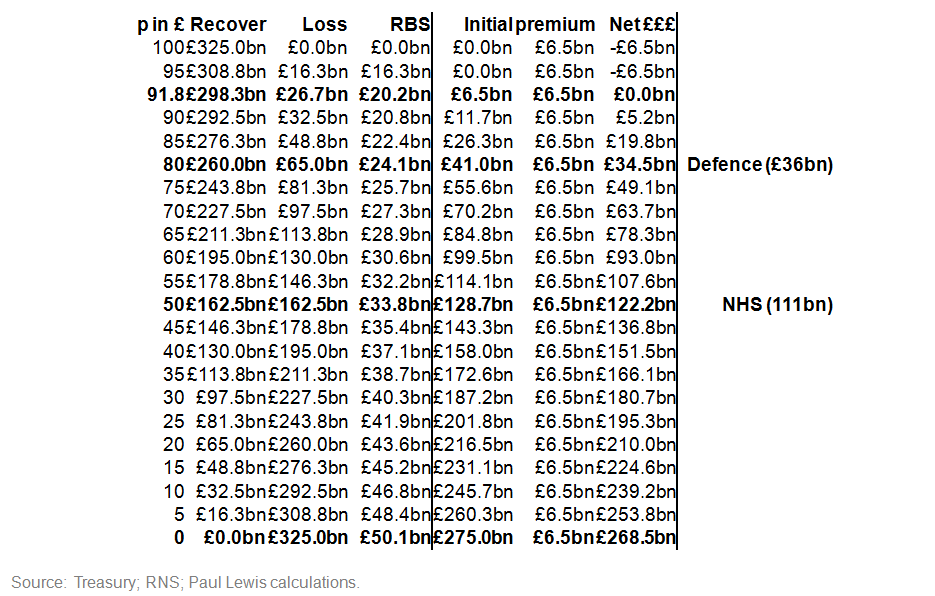
It turns out that RBS assets need to return 91.8p in the pound to break even. If we get 80p in the pound that will cost us as much as the defence budget. And if they fetch 50p in the £ that is the NHS closed down for a year.
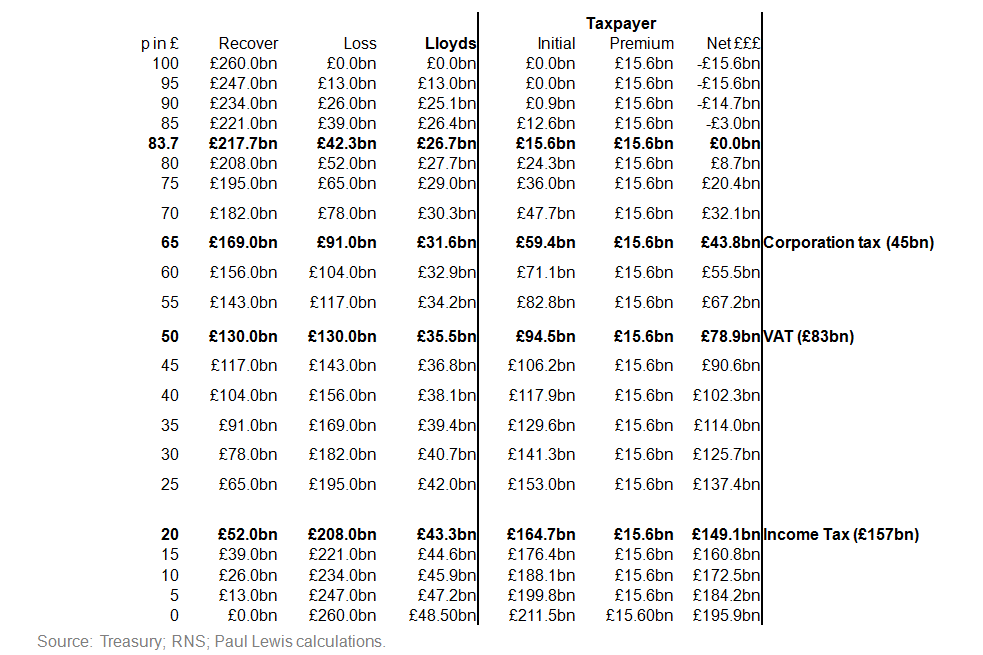
In the case of Lloyds the break even point is 83.7p in the pound. And if Lloyds’ assets fetch 65p in the pound it will cost us the whole take from Corporation taax. At 50p that is the whole VAT take. And 20p that is the same as scrapping income tax for a year.
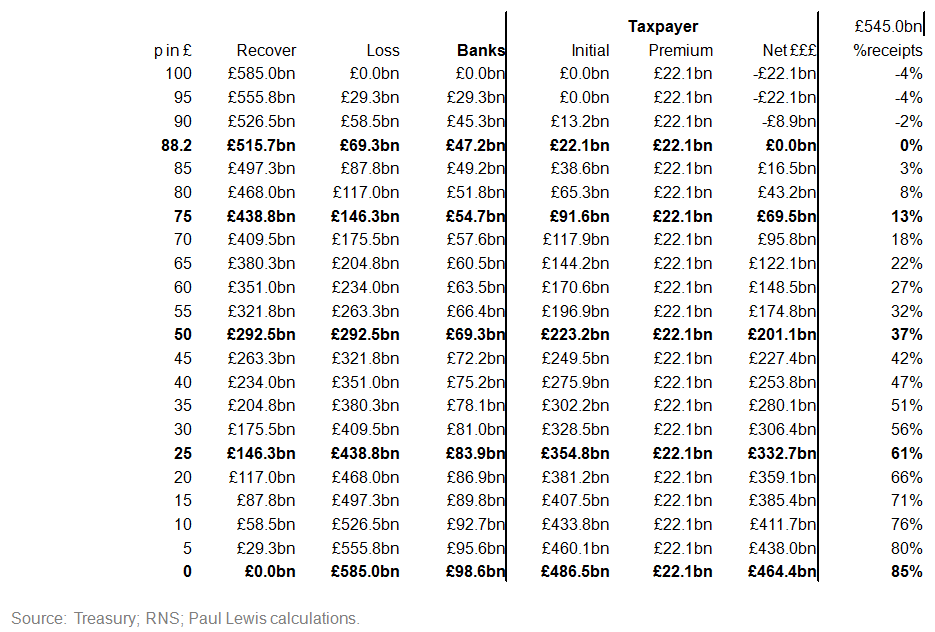
Adding the two together, the break even point for this double pot of toxic assets is 88.2p in the £. If they fetch 80p the defence budget’s gone. 65p and you can kiss goodbye to the NHS. 60p and you have spent every penny of income tax. And if they fetch nothing at all then you have spent 85% of one year’s total government expenditure.
That may be very unlikely – or even impossible as my Treasury man told me. But what is the likelihood of these assets being worth less than the break even point?
I spoke to RBS and Lloyds. RBS is apparently negotiating with the Treasury over the make up of its £325bn of toxic assets. Some will be very bad others will be good but what it wants to do is to take risk off its balance sheet to release money for further lending.
Lloyds took a different line. A spokesman, clearly using an agreed phrase, said the bank had “Included in the scheme assets outside the risk appetite of the group”.
So with assets outside the risk appetite of the group – no doubt one reason why its premium is three times higher than RBS’s) what chance getting 83.7p in the pound for them?
Altogether we are putting £464 billion of public money to guarantee assets that one of the banks admits are outside its risk appetite. And the other is negotiating to make as risky as possible.
Maths and Risk
And talking of
risk, how did we get here?
Adair Turner thinks he knows. He blames mathematicians. Yesterday the Turner Review said
“…the predominant assumption was that increased complexity had been matched by the evolution of mathematically sophisticated and effective techniques for measuring and managing the resulting risks.”
But then he went on to blame the managers.
“The very complexity of the mathematics used to measure and manage risk, moreover, made it increasingly difficult for top management and boards to assess and exercise judgement over the risks being taken. “
And the result was
“Mathematical sophistication ended up not containing risk, but providing false assurance that other prima facie indicators of increasing risk (e.g. rapid credit extension and balance sheet growth) could be safely ignored.”
He summed this up more briefly on television last night. The mistakes about assessing and managing risk were he said “A Worldwide intellectual failure”.
It’s not the first time.
Let’s take another big problem. Finding the energy the world needs without causing irreversible damage.
Easy to solve. All you need is a machine that produces energy from nothing.

Meet Villard de Honnecourt.

And his 13th century invention the Perpetuum Mobile. And ou can find similar ideas right up to the present day. Any one of these perpetual motion machines would solve global warming, giving us free energy forever. But they don’t.
Because they are impossible.
And so is eliminating risk. Naïve investors want high returns and no risk. Advisers tell them, rightly, that is impossible. But that is precisely what the banks thought they had found the secret of for themselves. Instead, all that has happened over the last five years is that risk has been hidden, manipulated, and lied about.
You convert capital into income. You then convert that income back into capital. Somehow that process creates free money out of thin air. It works. But only if you lie about the risk. So someone buys an investment at a high price because it is low risk. But pays too much for what is in fact a high risk investment that produces a low risk return. Without that lie it does not add up any more than the Perpetuum Mobile.
Now I’ve got into trouble for saying that a lie was at the heart of this problem. People have said it might be misleading. It might be misunderstanding. Is there any proof they were lying – told an untruth and knew it was untrue? But with a single Collateralised Debt Obligation – never mind what were called CDOs squared – needing thirty pages of formulae and legal language to describe it, very few of the people who bought and sold them actually knew what they were. But they bought and sold them with a reckless disregard for the truth and the consequences. That to me is lying. But whether you think they were lying or too careless – or perhaps too dim – to understand, perhaps they should not have been in charge of all the money in the world for so long.
The other theory of course is that it was nothing more nor less than a Ponzi scheme. The classic fraud that takes in money from investors promising them above average but risk free returns. The money is not invested it is simply kept by the scheme manager. Early investors are paid the promised returns using money that is taken from new investors. Enough money is kept back so that people who want to take their capital out can do so. As long as few people try to redeem their investment and the pool of new investors keeps growing the scheme can last a very long time.
Bernard Madoff enticed 13,000 investors to give him sums over 17 years which may total $65 billion, of which he and his family apparently have spent all but a billion.
The banks managed their fraud or if you prefer ‘global intellectual failure’ for about five or six years. When the scheme collapsed the overhang between what the funds were actually worth and their real value has had to be made up at least in part by £10 trillion paid out or guaranteed by taxpayers around the world. Money which was created out of nothing by banks has been replaced by money created out of nothing by Governments. That will have to be replaced by real money from taxpayers repaying these debts by their hard work over the next generation.
Index beaters
Let’s move on to something less controversial. This is about the missing number.
The one we desperately need and which no-one has ever provided.
One of the effects of the credit crunch has been the rather desperate search for somewhere to save money where it will not decline in value. We get many emails from people who have seen their pension pot fall in value by a third or more over the last six or twelve months and if retirement is just around the corner there is not much they can do.
And we hear from others who have been happily living on the 6% or 7% their cash has earned who are now rather desperately seeing that income fall to almost nothing.
They want to know what to do.
Now the traditional financial advice is – to get a better return you must take a risk. And if the banks have been misunderstanding risk and its management then the people who sell us financial products have not got a clue.
That mantra – to get a better return you must take a risk – is a dangerously partial truth. It is misinterpreted by sales staff and by the public to mean that if you take a risk then you will get a reward. But if taking a risk meant you would get a reward there wouldn’t be a risk would there?
He famous risk reward relationship normally means theinvestor takes the risk and the adviser gets the reward.
The truth is – as you all know – that if you take a risk you MAY get a better return. But you MAY get a worse one. You could lose money. You just might lose everything. That is the risk.
But of course that is not how it is presented. Worried investors are told that in order to get a better return they must take a risk. And of course those investments all carry commission – often quite a lot. And once you have bought the investment you are faced with annual charges which remain much the same whether the fund achieves its ‘aspiration’ to provide ‘top quartile’ returns or not. And it fails to say that in the past year top quartile returns could mean losing a substantial chunk of your money.
And if you want information the sales person – sorry financial adviser – will produce research to show that shares, or equities as they like to call them, have consistently produced the best returns in the long-term.
I am not happy with much of this research.
The big study is of course the Barclays Equity Gilt Study, a major piece of work produced by Barclays Capital and covering a sequence of 109 years back to the start of the last century.
Year after year it produces results that show how much better in the long term shares have been than gilts or of course cash.
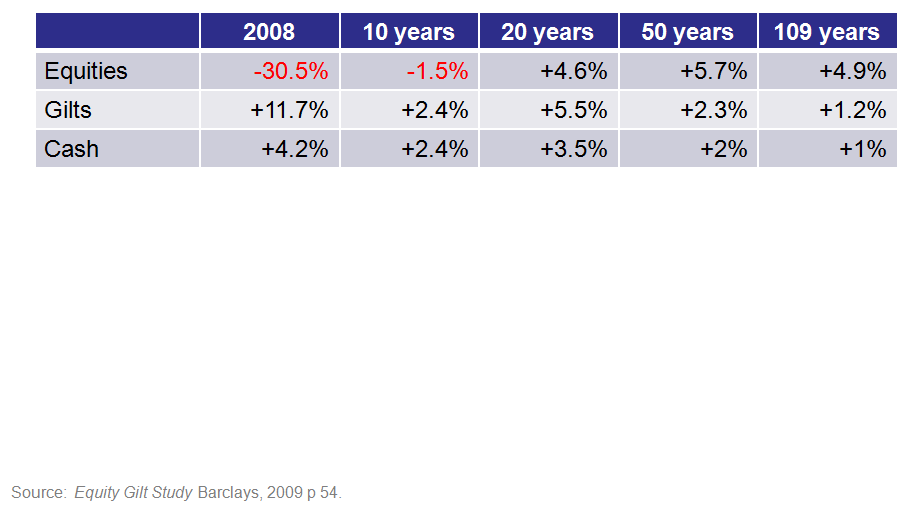
Here is the summary table from this year’s report. This year it shows cash savings did better than shares not only over the last year but over the last ten years – which it calls the lost decade. Only when you get to 20 years do equities outperform cash. But even here the risk premium, the extra average return for taking the risk of losing your money – is only 1.1 percentage points.
Over 50 years and even more so over 109 years equities reign supreme. Sadly most of us do not have a 109 year time frame – or even a 50 year one – for our investments. Ten years used to be considered long-term, and even for a pension twenty or thirty is what most people do. Even Fred Goodwin only paid in for ten years. Those retiring now who have saved up in a pension pot cannot have more than 20 years money stored up – personal pensions, AVCs etc only began in 1988.
But there are problems with these figures.
The equities calculation is based on the top 30 companies on the London Stock Exchange and dividends are reinvested. But the figures ignore the costs. They assume that the investor pays no charges – no initial charge and no ongoing management charges. That doesn’t happen in the real world. And that can deflate the figures by up to 5% upfront and typically 2% a year for a managed fund.
Now you can say that we are looking for average returns here so to hitch yourself to this wagon you should be using a tracker fund of some sort. Ordinary trackers generally charge 0.5% to 1% . Even Barclays Capital iShares – which I think it still owns – charges 0.4% a year on its FTSE Exchange Traded Fund. Those charges could easily wipe out the advantage over 20 years of shares. So the Equity Gilt study exaggerates the return on shares.
And if the research exaggerates the return on shares, it underestimates the return on cash. The Study does look at cash and takes pure cash in the sense of a building society deposit account back to 1946. It does this by using what it calls a typical building society account. Since 1998 that has been the Nationwide Invest Direct account. For the decade before that it was the Halifax Liquid Gold account – recommended by Arthur Daley as I recall. And before that it used an average return on a building society share account.
There are also figures produced by the Bank of England which some other comparisons between cash and shares use.
Let’s look first at the last two years or so January 2007 to date.
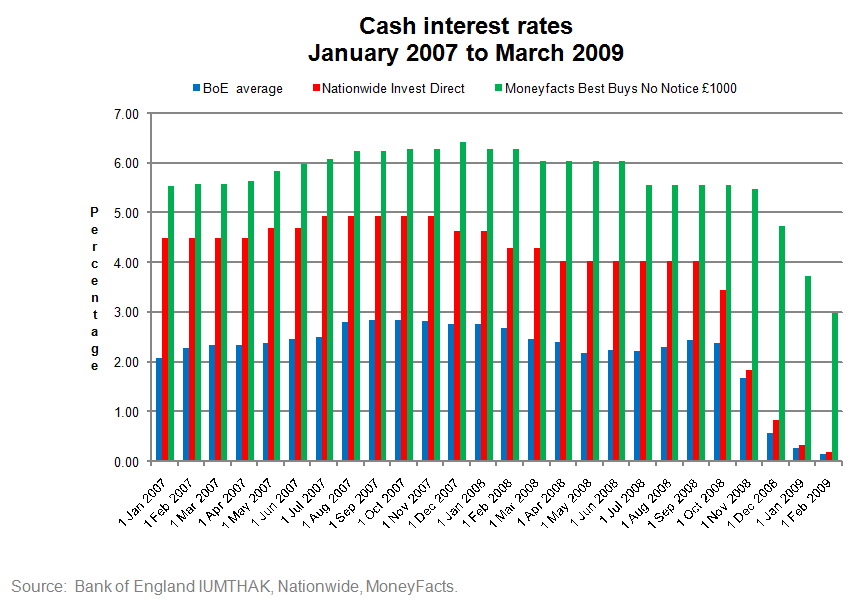
Here is the Bank of England average in blue. Then the Nationwide account in red. You can see that the Nationwide account is much better than the BoE average, around twice the rate for most of the time and on average 1.67 percentage points better. But this is far less than the best buys that are available. Here in green are the best buys done for me this week by MoneyFacts. They are on average 1.81% above Nationwide and 3.48 percentage pts above the BoE average.
In other words if you moved your money actively you could add a couple of percentage points onto your return compared to leaving your money in Nationwide used in part by the Barclays study.
But in fact the Barclays study is worse than that in the long run. Over the 109 year long run it uses 3 month Treasury Bills as a substitute for cash.
Now I don’t have those figures month by month for comparison here. But if we take the figures from Barclays comparing building societies with T Bills from 1946 the average return on the building society account is higher than the T Bills – compound about 7.07% compared with 6.66%. And over 63 years that gives you a return that is 22% higher.
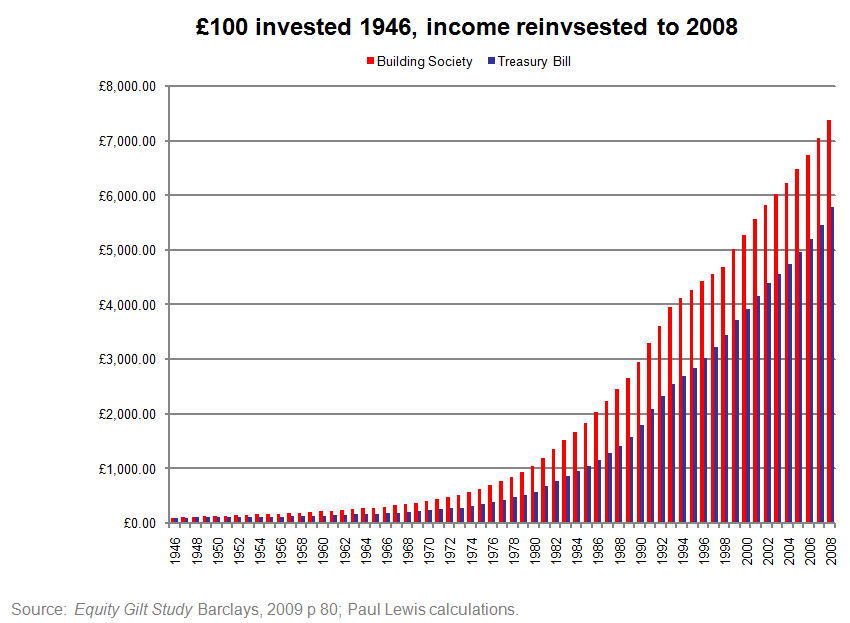
If we factor that into the returns over the time from January 2007 we find that the cash estimates using treasury bills underestimate the typical building society account and even more so the best buys
And if you look at one year bonds in building societies or banks – I haven’t done those figures here – the difference is even greater.
So someone who is an active saver – a rate tart as we call them – can come much closer than this research suggests to stockmarket performance over long periods without taking any risk.
Now there is one problem with this. These cash returns are exaggerated because they do not deduct income tax. For those that pay it that has been 20-40% since 1946. Cash ISAs allow you to avoid that tax on a small amount each year – but at the end of 2008 there was a total of £142 billion in cash ISAs.
And if we were allowed to put our pension funds in cash rather than in shares or other funds then that issue would not arise.
What is needed is a sound, well researched number to represent the best daily cash rate you can earn on your money. And then the active cash savers would be able to compete fairly and compare themselves with the people promoting investment and risk.
And who knows someone might just do the job for them – for a small fee – which would then have to be built in to the figures.
But a good sound measure of the best cash returns day by day – that is my challenge to the fixings department of Thomson Reuters.
Thank you.